Siddhant Deval
Siddhant DevalAuthor
Senior Full-Stack Engineer·Aug 30, 2026·20 min read

Database War Stories: Failure Modes & Recovery Patterns

Production database failures are predictable — each paradigm has a canonical failure mode that appears reliably at scale. This capstone article catalogs the most common incidents across PostgreSQL, MongoDB, DynamoDB, Redis, Elasticsearch, CockroachDB, and Cassandra, with per-paradigm recovery playbooks and GDPR compliance failure modes.

Technical Series

Modern Database Paradigms

Part 8 of 8

Database War Stories: Failure Modes & Recovery Patterns

Selecting the right database is a foundational architectural decision; data gravity ultimately dictates the scalability and resilience of an application — choose the paradigm first, the product second. The series has covered what to choose and when. This capstone article covers what happens when you get it wrong — or when you get it right but miss an operational detail. Every failure mode catalogued here has been observed in production systems. None of them are edge cases. They are the canonical failure patterns that appear reliably as databases scale, and understanding them before they happen is the difference between a 2-hour incident and a 2-week recovery.

1. PostgreSQL — Connection Exhaustion & VACUUM Bloat

Connection Pool Exhaustion
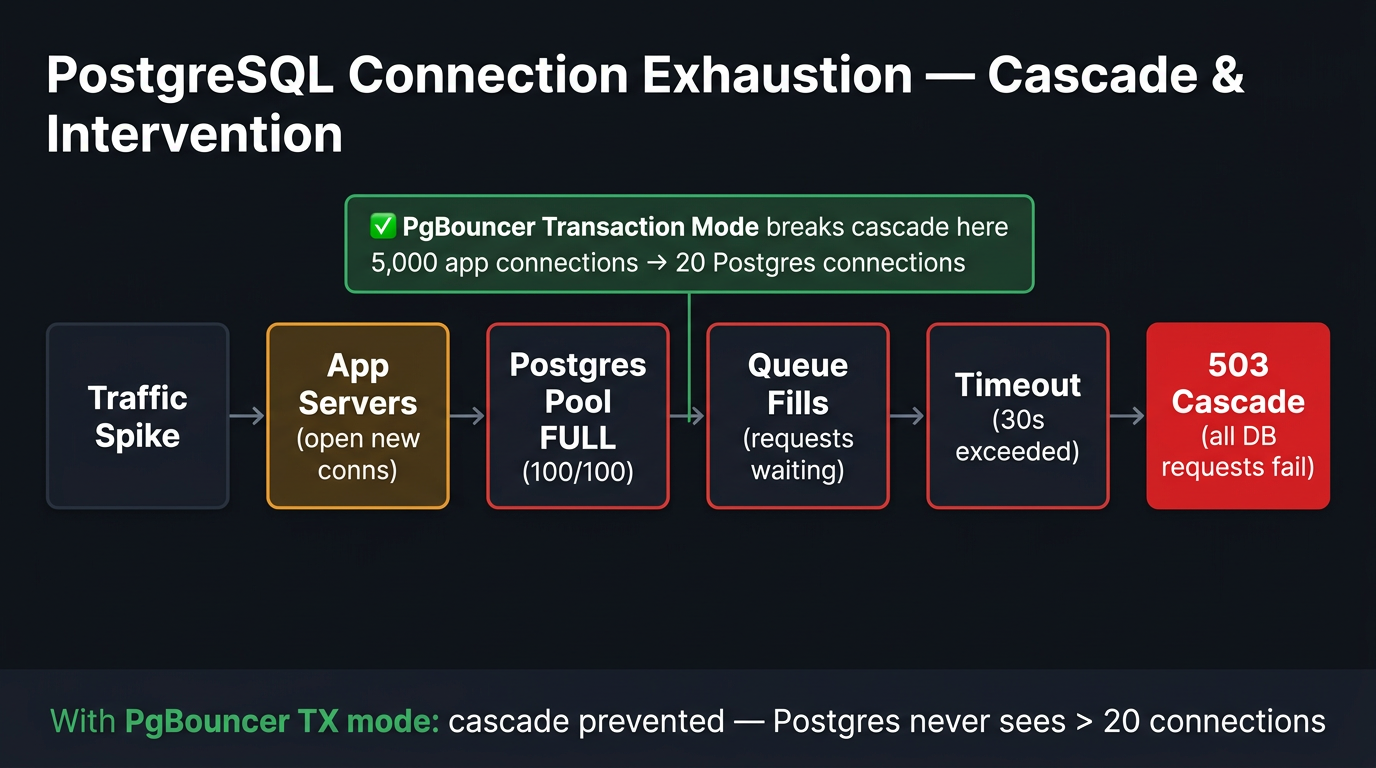
Incident timeline:
  T+0:  Traffic spike — 10× normal request rate (product launch, viral moment)
  T+1:  Application servers open new connections to Postgres (max_connections = 100)
  T+2:  Connection pool saturates — new connection attempts queue
  T+3:  Queue fills — new requests receive "too many connections" error
  T+4:  Application returns 500 for all requests requiring database access
  T+5:  On-call engineer investigates — Postgres is healthy, connection pool is the problem
  T+30: PgBouncer deployed — connections drop from 100 to 5 (pooler connections)
  T+31: Service recovers
PostgreSQL connection exhaustion cascade — client spike → connection pool saturation → query queue → timeout → application error, with PgBouncer transaction-mode intervention point labeled at the recovery step.
PostgreSQL connection exhaustion cascade — client spike → connection pool saturation → query queue → timeout → application error, with PgBouncer transaction-…
bash
# Detection: connection count approaching max_connections
SELECT count(*), state, wait_event_type
FROM pg_stat_activity
GROUP BY state, wait_event_type
ORDER BY count DESC;

# Immediate mitigation: kill idle connections
SELECT pg_terminate_backend(pid)
FROM pg_stat_activity
WHERE state = 'idle'
  AND query_start < NOW() - INTERVAL '5 minutes';

# Permanent fix: PgBouncer in TRANSACTION mode
# pgbouncer.ini:
[databases]
production = host=postgres-primary.internal port=5432 dbname=production

[pgbouncer]
pool_mode = transaction
max_client_conn = 5000   # application connections to PgBouncer
default_pool_size = 20   # PgBouncer connections to Postgres
server_idle_timeout = 600
Crucial Requirement
PgBouncer in TRANSACTION mode (not SESSION mode) is required for connection multiplexing to work. In SESSION mode, one application connection holds one Postgres connection for its entire lifetime — no gain. In TRANSACTION mode, a Postgres connection is checked out only for the duration of a transaction — this is the multiplexing that makes 5,000 app connections share 20 Postgres connections safely.

VACUUM Bloat

sql
-- Detect table bloat: dead tuples accumulating faster than autovacuum can reclaim them
SELECT relname,
       n_live_tup,
       n_dead_tup,
       round(n_dead_tup::numeric / (n_live_tup + n_dead_tup + 1) * 100, 1) AS dead_pct,
       last_autovacuum
FROM pg_stat_user_tables
WHERE n_dead_tup > 10000
ORDER BY dead_pct DESC;
-- dead_pct > 20% on a high-write table is a signal to tune autovacuum

-- Tune autovacuum for a high-churn table:
ALTER TABLE orders SET (
  autovacuum_vacuum_scale_factor = 0.01,   -- vacuum when 1% of rows are dead (vs. 20% default)
  autovacuum_vacuum_cost_delay = 2          -- reduce throttle delay (ms)
);

2. MongoDB — Unbounded Arrays & Write Concern

The 16MB Document Limit in Production

javascript
// Failure pattern: audit log embedded in user document
// 10,000 events × ~200 bytes = 2MB → 50,000 events = 10MB → 80,000 events = 16MB → CRASH
// Error: "BSONObjectTooLarge" thrown on the write that exceeds 16MB
// Detection too late: the document grew silently for months

// Detection: find documents approaching the limit
db.users.aggregate([
  { $project: { docSize: { $bsonSize: '$$ROOT' }, _id: 1 } },
  { $sort: { docSize: -1 } },
  { $limit: 20 }
])
// Any document > 10MB is a ticking clock

// Recovery: migrate unbounded array to a separate collection
// Step 1: extract events
const users = await db.users.find({ 'auditLog.100': { $exists: true } }) // has > 100 events
for await (const user of users) {
  const events = user.auditLog.map(e => ({ ...e, userId: user._id }))
  await db.audit_events.insertMany(events)
  await db.users.updateOne({ _id: user._id }, { $unset: { auditLog: '' } })
}

Write Concern Misconfiguration

javascript
// ❌ Broken: w:0 — fire and forget, no acknowledgment
await collection.insertOne(document, { writeConcern: { w: 0 } })
// If MongoDB primary crashes before the write is flushed → silent data loss
// No error thrown → application thinks write succeeded

// ✅ Correct: w:'majority' — committed to majority of replica set before ack
await collection.insertOne(document, { writeConcern: { w: 'majority', j: true } })
// j: true — write committed to journal (WAL) before ack → survives crash

3. DynamoDB — Hot Partitions & Scan Cost Explosion

Hot Partition
typescript
// ❌ Broken: using a timestamp or sequential ID as partition key
await dynamoDB.put({ Item: {
  PK: new Date().toISOString(),  // all "current" writes go to same partition
  SK: userId,
  event: 'page_view'
}})
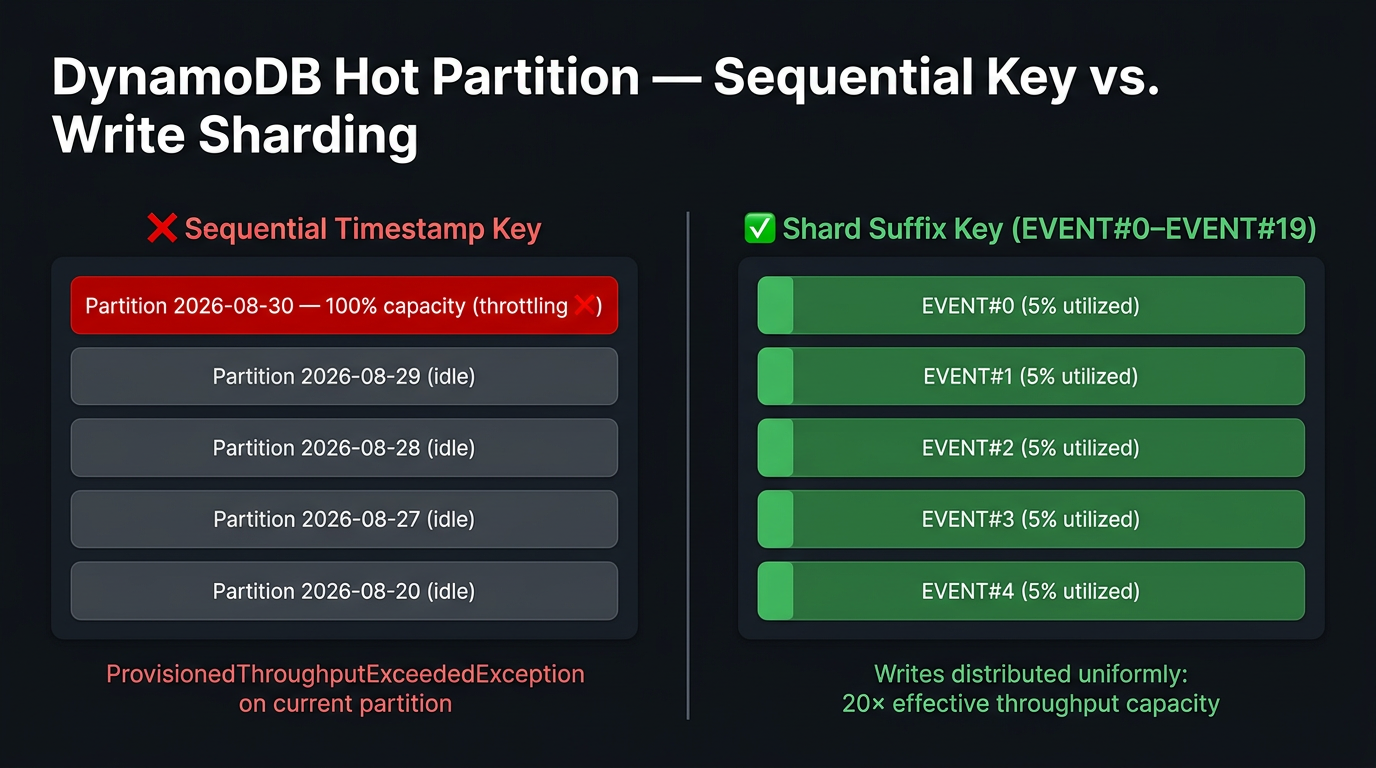
// DynamoDB partitions by hash of PK — sequential timestamps hash to same shard
// Single partition becomes the bottleneck → ProvisionedThroughputExceededException

// ✅ Correct: write sharding — add random suffix to distribute writes
const shardCount = 20
const shardId = Math.floor(Math.random() * shardCount)
await dynamoDB.put({ Item: {
  PK: `EVENT#${shardId}`,      // PK: EVENT#0 through EVENT#19 — 20 partitions
  SK: new Date().toISOString(), // unique within partition
  userId,
  event: 'page_view'
}})

// Reading: fan out to all shards, then merge
const results = await Promise.all(
  Array.from({ length: shardCount }, (_, i) =>
    dynamoDB.query({ KeyConditionExpression: 'PK = :pk', ExpressionAttributeValues: { ':pk': `EVENT#${i}` } })
  )
)
Hot DynamoDB partition from uniform sequential key (anti-pattern, left) versus composite partition key with write-shard suffix (correct, right), with throughput annotations showing even distribution across partitions.
Hot DynamoDB partition from uniform sequential key (anti-pattern, left) versus composite partition key with write-shard suffix (correct, right), with through…

Scan Cost Explosion

typescript
// ❌ Broken: Scan in production — reads every item in the table
const result = await dynamoDB.scan({ TableName: 'events', FilterExpression: 'userId = :uid' })
// Scan reads ALL items (billable) then filters → at 10M items, costs $2.50 per invocation
// A page that calls this 1000x/day costs $75K/month in DynamoDB read units alone

// ✅ Correct: always Query with a partition key
const result = await dynamoDB.query({
  TableName: 'events',
  KeyConditionExpression: 'PK = :pk',
  ExpressionAttributeValues: { ':pk': `USER#${userId}` }
})
// Reads only items in this partition — O(result size), not O(table size)

4. Redis — Thundering Herd & AOF Rewrite OOM

Thundering Herd on Cold Start

typescript
// Failure pattern:
// T+0: Deploy flushes Redis cache (or all TTLs expire simultaneously after a restart)
// T+1: 50,000 requests hit the application — all cache MISS
// T+2: 50,000 requests query Postgres simultaneously
// T+3: Postgres connection pool exhausts → 500 errors cascade

// Prevention: mutex-based cache population (only ONE request populates the cache)
async function getProductWithMutex(id: string): Promise<Product> {
  const cached = await redis.get(`product:${id}`)
  if (cached) return JSON.parse(cached)

  const lockKey = `lock:product:${id}`
  const lockAcquired = await redis.set(lockKey, '1', { NX: true, EX: 5 })

  if (!lockAcquired) {
    // Another request is populating — wait and retry
    await sleep(50)
    return getProductWithMutex(id)  // tail-recursive retry
  }

  try {
    const product = await pg.query('SELECT * FROM products WHERE id = $1', [id])
    await redis.setEx(`product:${id}`, 300, JSON.stringify(product))
    return product
  } finally {
    await redis.del(lockKey)  // always release the lock
  }
}

AOF Rewrite OOM

bash
# Failure: BGREWRITEAOF triggered during peak write load
# Redis forks a child process to rewrite the AOF file
# Child process inherits full memory snapshot → 2× memory usage during rewrite
# If available memory < current Redis memory: OOM kill → full data loss

# Detection:
redis-cli info memory | grep aof_rewrite

# Prevention: schedule AOF rewrites during low-traffic windows
redis-cli config set auto-aof-rewrite-percentage 200  # only rewrite at 2× file size growth
redis-cli config set auto-aof-rewrite-min-size 256mb   # never rewrite files < 256MB

# Reserve 50% of instance memory for AOF rewrite headroom
# If Redis uses 4GB of a 8GB instance, AOF rewrite child needs up to 4GB → fits in 8GB

5. Elasticsearch — Mapping Explosion & Split Brain

Mapping Explosion

bash
# Failure: log ingestion pipeline sends documents with dynamic field names
# (e.g., HTTP headers, user-agent strings, arbitrary JSON payloads)
# Elasticsearch creates a new mapping entry for every unique field name
# At 10,000 unique dynamic fields: cluster state bloats → GC pauses → query timeouts

# Detection:
curl -s "http://elasticsearch:9200/logs/_mapping" | python3 -m json.tool | grep -c '"type"'
# > 1000 unique field types is a warning sign

# Recovery: force a reindex with strict mapping
curl -X PUT "http://elasticsearch:9200/logs-v2" -H 'Content-Type: application/json' -d '{
  "mappings": { "dynamic": "strict", "properties": { ... explicit fields ... } }
}'
# Then reindex from old index to new:
curl -X POST "http://elasticsearch:9200/_reindex" -d '{
  "source": { "index": "logs" }, "dest": { "index": "logs-v2" }
}'

6. CockroachDB — Clock Skew & Retry Storm

Clock Skew-Induced Cluster Pause

bash
# CockroachDB requires all nodes to be within 500ms of each other (via NTP)
# Failure: a node's system clock drifts > 500ms → CRDB pauses all writes on that node
# Error seen by application: "transaction rejected because of a suspicious timestamp"

# Detection:
cockroach debug zip --url="postgres://root@localhost:26257" /tmp/debug.zip
# Check: cockroach.log for "clock skew" events

# Prevention: enforce NTP synchronization
timedatectl status  # verify NTP is active
# On EC2: Amazon Time Sync Service uses chrony by default — verify it is running
systemctl status chronyd

# Alert threshold: if |local_time - NTP_time| > 250ms → page before CRDB pauses

7. Cassandra — Tombstone Accumulation

bash
# Failure: DELETE-heavy workload accumulates tombstones faster than compaction removes them
# At 10M tombstones per partition: read queries must skip all tombstones → latency spike
# Error: "Scanned over X tombstones during query" warnings in Cassandra logs

# Detection:
nodetool tpstats | grep TombstoneAware
# Read repair tombstone count > 100K per query is a red flag

# Mitigation: trigger compaction explicitly on affected keyspace
nodetool compact my_keyspace my_table

# Prevention for time-series data: use TTL instead of DELETE
INSERT INTO sensor_events (sensor_id, ts, value) VALUES (?, ?, ?)
USING TTL 604800;  -- auto-expire after 7 days — no tombstone written

8. GDPR Compliance Failure Modes

Right-to-Erasure in Append-Only Stores

Compliance failure: user requests erasure → team deletes from Postgres → done
But: a CDC pipeline has already replicated the data to:
  - Elasticsearch index (still searchable)
  - Cassandra (tombstone, not erased — data in SSTables)
  - Kafka topic (immutable log — data retained for 7 days)
  - S3 data lake (CSV export from 3 months ago — still contains PII)

The correct erasure strategy:
  1. Postgres: DELETE + audit log of the deletion
  2. Elasticsearch: DELETE by userId, refresh index
  3. Cassandra: write tombstone + set TTL = 1 day; wait for compaction
  4. Kafka: mark as deleted in the consumer group; compact the topic
  5. S3: use S3 Object Lock tagging + lifecycle rule to expire the object
  6. Document: record all 5 steps in a compliance audit log with timestamps
Crucial Requirement
GDPR right-to-erasure is not a single DELETE statement — it is a multi-store, multi-step, audited process. Design your data map (which stores hold which PII fields) before your first user registration, not after your first erasure request. Tooling like Piiano Vault, AWS Macie, or a custom PII registry simplifies the audit trail.

9. Per-Paradigm Recovery Playbooks

ParadigmTop 2 Failure ModesImmediate MitigationNever Do This
PostgreSQLConnection exhaustion; VACUUM bloatPgBouncer transaction mode; tune autovacuumVACUUM FULL on a live high-traffic table
MongoDB16MB document limit; write concern w:0Migrate unbounded arrays; set w:majorityStore audit logs in the user document
DynamoDBHot partition; Scan in productionWrite-shard suffix; always Query with PKUse FilterExpression without KeyConditionExpression
RedisAOF rewrite OOM; Thundering HerdReserve 50% RAM; mutex cache populationRestart Redis without persistence enabled
ElasticsearchMapping explosion; split-braindynamic: strict; enforce minimum_master_nodesUse Elasticsearch as a primary database
CockroachDBClock skew; serialization retry stormEnforce NTP; implement retry with backoffIgnore 40001 SQLSTATE codes
CassandraTombstone accumulation; wrong compactionUse TTL instead of DELETE; switch to TWCSUse STCS for time-series workloads

Summary

ConceptRule
Connection exhaustionPostgreSQL connection exhaustion is the #1 scaling failure — deploy PgBouncer in transaction mode before you need it.
DynamoDB hot partitionsDynamoDB hot partitions originate from non-uniform partition key access — model with write sharding from day one, not after the incident.
Cache stampedeRedis cache stampede requires probabilistic early expiry or a distributed lock on cache population — TTL configuration alone does not prevent it.
Elasticsearch mappingElasticsearch mapping explosion is a schema governance failure — enforce dynamic: strict and index templates in all production indexes.
GDPR erasureGDPR right-to-erasure is architecturally incompatible with immutable append-only stores; design a tombstone or encryption-key-deletion strategy before the first write.
Research & Synthesis Note

This article was developed with AI-assisted deep search, specification cross-referencing, and technical research synthesis.

#Database Reliability#Incident Response#PostgreSQL#DynamoDB#Redis#Cassandra#CockroachDB#GDPR
Siddhant Deval

Written by Siddhant Deval

Senior Full-Stack Engineer building high-scale architectures, browser performance engineering systems, and SaaS platforms.