Distributed Observability: OpenTelemetry, Trace Propagation & Structured Logging
Observability in distributed systems is not logging — it is the deliberate design of three coordinated signal types (traces, metrics, logs) under a unified correlation model. Without a Trace ID threading through every service hop, incident resolution degrades from minutes to hours. This article builds the full production observability stack: OpenTelemetry SDK instrumentation, W3C traceparent propagation, tail-based sampling, Jaeger/Grafana Tempo backends, and structured JSON logging correlated by trace and span IDs.
API Architecture & System Resilience
Distributed Observability: OpenTelemetry, Trace Propagation & Structured Logging
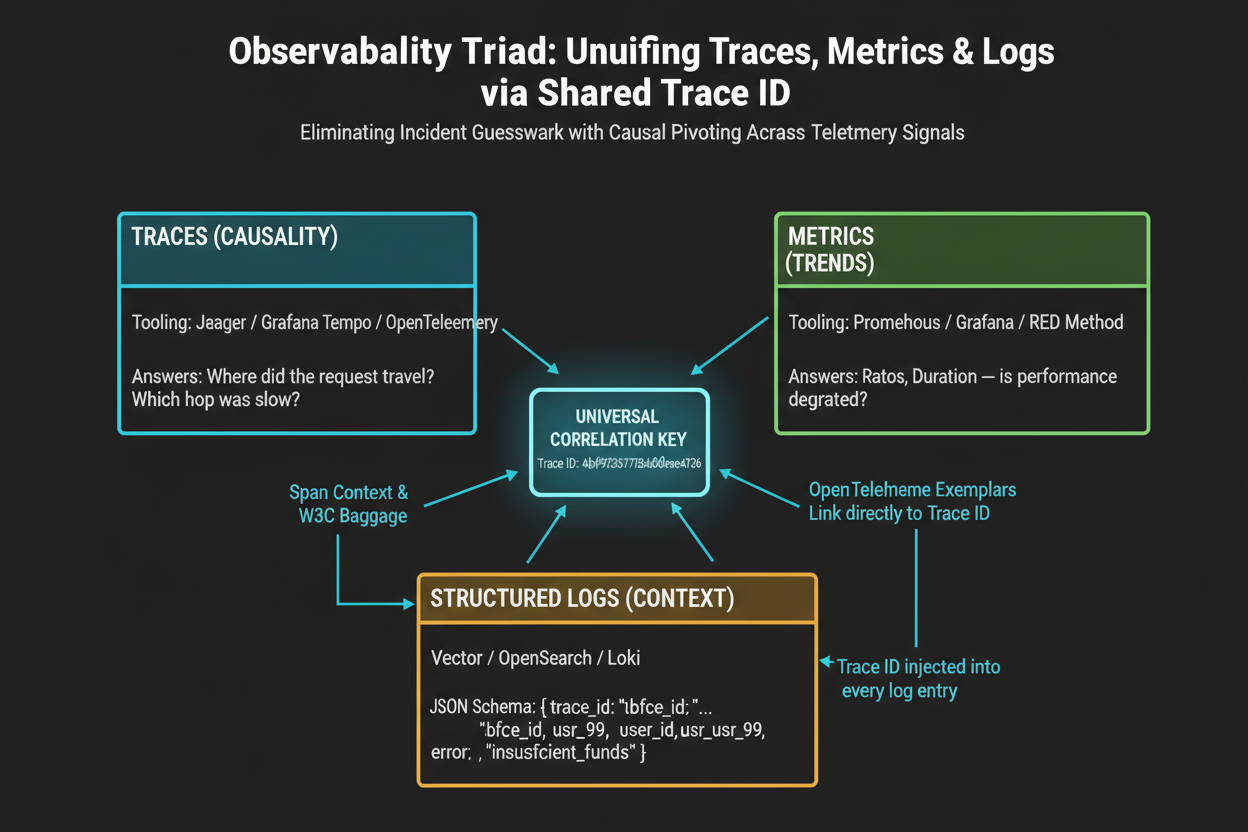
Senior engineers don't just wire services together — they design the boundary: the contract, the trust model, the failure envelope, and the signal pipeline that proves it's working. The signal pipeline is observability — and the most common misconception about observability in distributed systems is that it means "add logging." Logs alone are insufficient: a log entry from Order Service that says "payment failed" tells you the outcome but not the cause, not the path the request took, not how long each hop took, and not whether the failure is isolated or systemic. You need three coordinated signals — traces, metrics, and logs — and you need them correlated by a shared Trace ID. Without that correlation, every incident requires a detective investigation instead of a structured query.
Series positioning: This is Part 6 of the API Architecture & System Resilience series. It builds on the trace ID initiation from the API Gateway (Part 2) and the sidecar-level telemetry from the Service Mesh (Part 3). The GraphQL Backend & API Design series covers GraphQL-specific observability (operation-level tracing, DataLoader batch metrics, field usage analytics) as a complementary lens — this article covers the distributed system foundation that any backend stack depends on.
1. The Three Pillars — Why You Need All Three
2. OpenTelemetry SDK Instrumentation
2.1 Auto-Instrumentation vs Manual Spans
2.2 Manual Spans for Business Logic
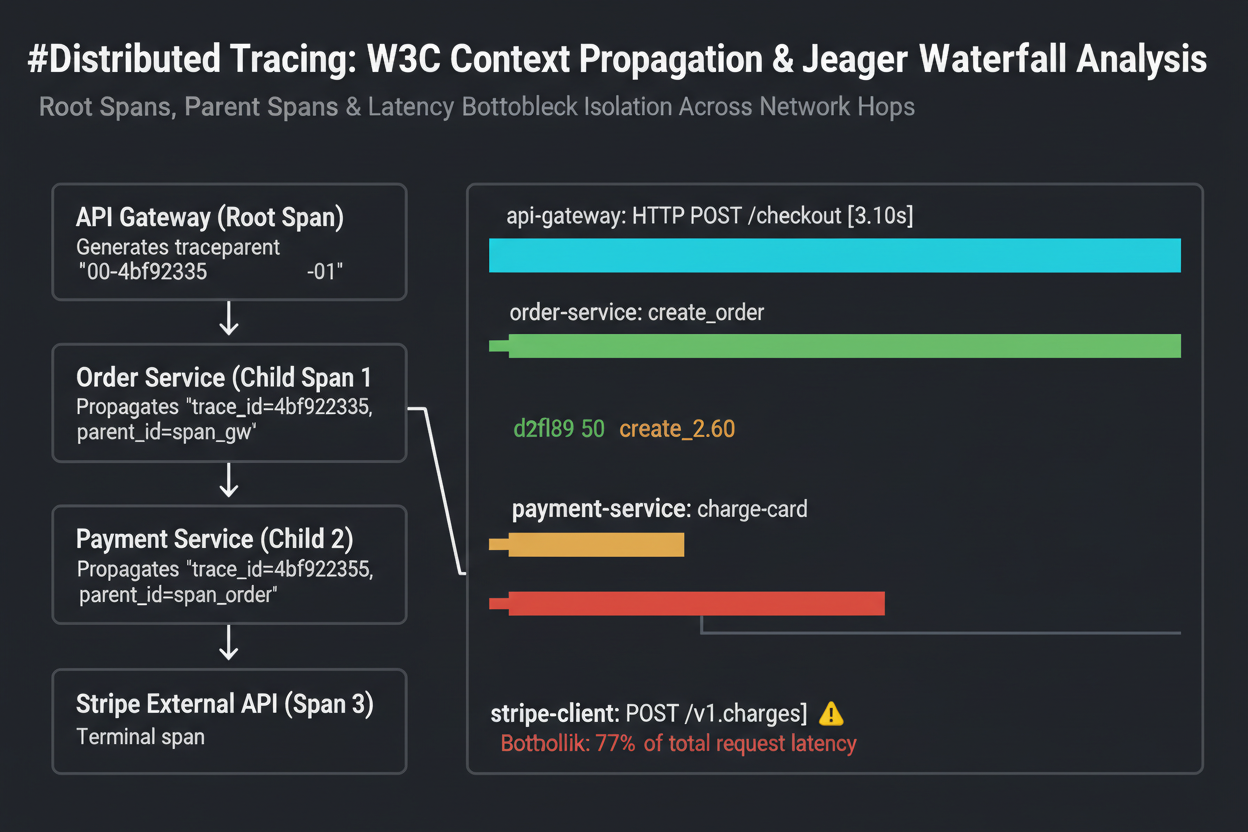
3. Trace ID Propagation: The W3C traceparent Header
3.1 The propagation Format
3.2 What Breaks Propagation
4. Sampling Strategies
4.1 Head-Based Sampling (Simple, Loses Rare Errors)
4.2 Tail-Based Sampling (Production-Correct)
5. Span Design: Naming Conventions & Attribute Cardinality
5.1 Semantic Conventions (Never Invent Your Own)
5.2 Span Events for High-Cardinality Data
6. Backends: Jaeger vs Grafana Tempo
| Criterion | Jaeger | Grafana Tempo |
|---|---|---|
| Storage | Elasticsearch or Cassandra (queryable) | Object storage (S3/GCS) — not queryable by default |
| Query capability | Full attribute/tag search | Requires Tempo + Loki + Prometheus (TraceQL) |
| Cost | High (Elasticsearch/Cassandra cluster) | Low (object storage) |
| Grafana integration | Via Jaeger plugin | Native (Tempo datasource) |
| Trace-to-log correlation | Manual (copy trace_id, search Kibana) | Automatic via Loki (Derived Fields) |
| Scale | Medium (millions of spans/day) | Very high (billions of spans/day) |
| Best for | Teams with existing Elasticsearch; smaller scale | High-throughput services; Grafana-native stacks |
7. Centralized Structured Logging
7.1 JSON Log Schema Design
7.2 Log Output — Instant Jaeger → Log Correlation
8. RED Method Alerting
Summary
| Signal | Rule |
|---|---|
| Traces | Every service must forward traceparent header — breaking propagation silently disconnects the trace chain |
| Span attributes | Semantic conventions only; low-cardinality only — user IDs / order IDs go in span events |
| Sampling | Tail-based in production: 100% error + slow traces retained; 1% baseline; head-based only in dev |
| Span events | Use for high-cardinality data (user IDs, order IDs, request payloads) instead of attributes |
| Backends | Grafana Tempo for scale + cost; Jaeger for queryable attribute search and existing Elasticsearch |
| Logs | Structured JSON always; trace_id + span_id mandatory fields on every log entry |
| Log correlation | Loki Derived Fields config: span_id → link to Tempo trace — enables one-click pivot |
| Alerting | RED method: Rate (traffic drop), Errors (error rate > 5%), Duration (P99 > SLO threshold) |
What's Next
In Part 7, we close the resilience loop — Part 7: Retry Engineering covers the mathematics of thundering herd prevention (full jitter algorithms), SLA-derived retry budget calculation, idempotency as the prerequisite for safe retries, and DLQ-based async retry patterns that maintain delivery guarantees in event-driven systems.
This article was developed with AI-assisted deep search, specification cross-referencing, and technical research synthesis.