Performance is not a feeling — it is a measurement. Debounce and throttle are closure-based concurrency primitives, not library imports. Native browser observers (Intersection, Mutation, PerformanceObserver) replace inefficient polling with O(1) event-driven patterns that compose with the main thread's scheduling model.
The runtime is not a black box — and performance is not a feeling. "This page feels slow" is not actionable. "The main thread has a 340ms long task between the LCP paint and the first user interaction" is. Debounce and throttle are not Lodash features — they are closure-based concurrency primitives that you should be able to write from first principles in an interview or a production debugging session. Native browser observers are not niche APIs — they are how performant engineering teams avoid the scroll event polling anti-pattern that degrades with page complexity. This article instruments, measures, and fixes.
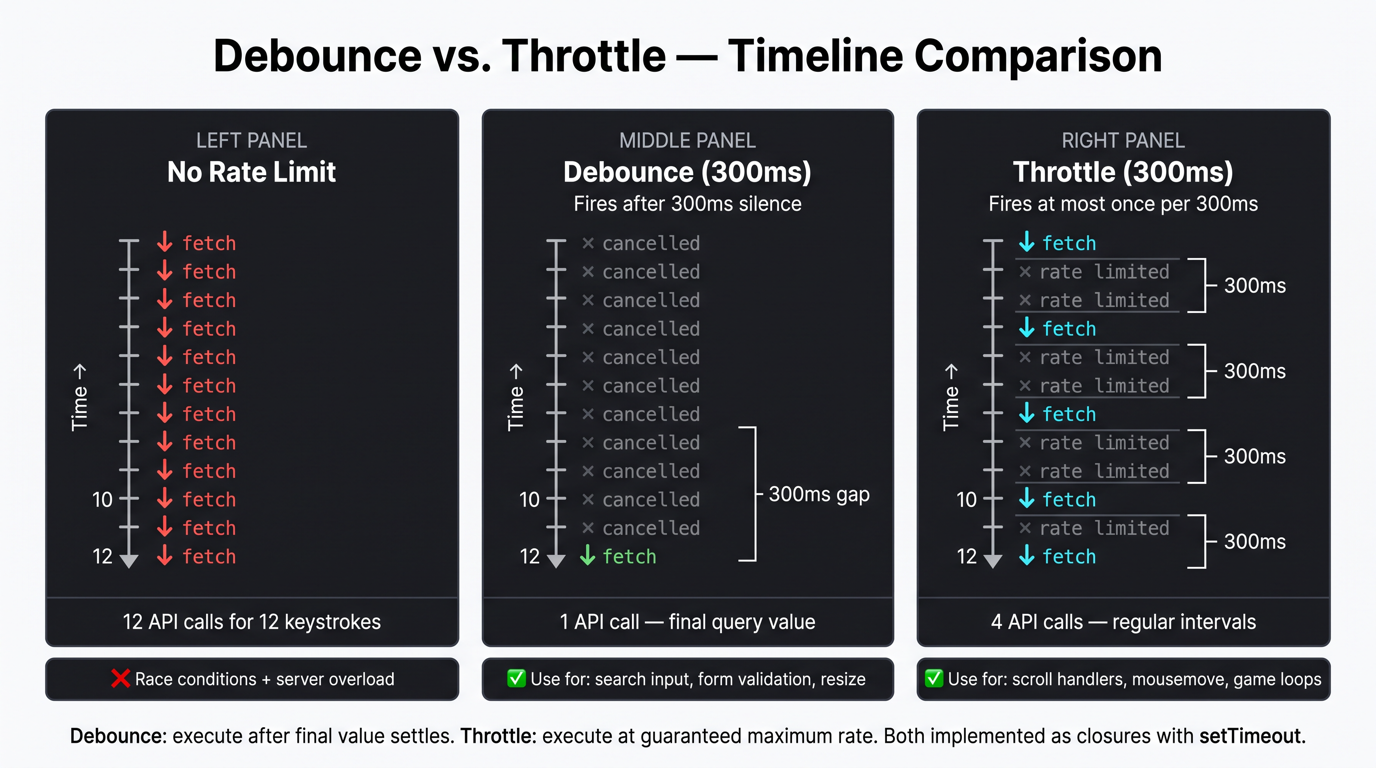
Both debounce and throttle control the rate at which a function executes in response to high-frequency events. They differ in when the execution happens:
Debounce: execute only after N ms of silence — useful when you only care about the final state after rapid input
Throttle: execute at most once per N ms window — useful when you need guaranteed execution at a maximum rate
// Throttle: executes at most once per N ms, guarantees execution at regular intervalsfunction throttle<Argsextendsunknown[]>(
fn: (...args: Args) =>void,
limitMs: number
): (...args: Args) =>void {
let lastCallTime = 0lettimerId: ReturnType<typeofsetTimeout> | null = nullreturnfunctionthrottled(...args: Args) {
const now = Date.now()
const timeSinceLast = now - lastCallTime
if (timeSinceLast >= limitMs) {
// Enough time has passed — execute immediately
lastCallTime = now
fn(...args)
} elseif (!timerId) {
// Not enough time, but no pending execution — schedule for the gap
timerId = setTimeout(() => {
lastCallTime = Date.now()
timerId = nullfn(...args)
}, limitMs - timeSinceLast)
}
// If timerId is already set: a call is already pending for this window — ignore
}
}
// Usage: scroll handler — execute at most once per 100ms regardless of scroll speedconst handleScroll = throttle(() => {
const scrollY = window.scrollYupdateStickyHeader(scrollY)
updateProgressBar(scrollY)
}, 100)
window.addEventListener('scroll', handleScroll)
// Even at 60fps (every 16ms), handleScroll only executes every 100ms
Expand
Before/after timeline diagram in three panels arranged horizontally. Panel 1 labeled 'No Rate Limit (Dangerous)' with red border. Timeline shows 12 small eve…
The Performance API provides a high-resolution timeline for instrumenting your application's execution. Unlike Date.now() (millisecond precision, affected by NTP clock adjustments), performance.now() uses the High Resolution Time API — sub-millisecond precision, monotonically increasing, unaffected by system clock changes.
// ✅ Mark named points on the performance timeline
performance.mark('db-query-start')
const users = await db.query('SELECT * FROM users WHERE active = TRUE')
performance.mark('db-query-end')
// Measure the duration between two marksconst measure = performance.measure(
'db-query-duration', // Name of the measurement'db-query-start', // Start mark'db-query-end'// End mark
)
console.log(`DB query took: ${measure.duration.toFixed(2)}ms`)
// → DB query took: 23.45ms (sub-millisecond precision)// Retrieve all marks and measuresconst entries = performance.getEntriesByType('measure')
// [{ name: 'db-query-duration', duration: 23.45, startTime: 1024.2, ... }]// Clean up to avoid accumulating entries across many requests
performance.clearMarks()
performance.clearMeasures()
PerformanceObserver listens for performance entries as they are recorded — useful for CI budget gates, production monitoring, and detecting long tasks that block the main thread:
TYPESCRIPT
// Observe Long Tasks — any task > 50ms on the main threadconst observer = newPerformanceObserver((list) => {
for (const entry of list.getEntries()) {
console.warn(
`Long task detected: ${entry.duration.toFixed(0)}ms ` +
`at ${entry.startTime.toFixed(0)}ms since page load`
)
// In production: send to monitoring
analytics.track('long_task', {
duration: entry.duration,
startTime: entry.startTime,
})
}
})
observer.observe({ type: 'longtask', buffered: true })
// buffered: true → also reports any long tasks that already occurred before observation started// Observe Paint Timing — LCP, FCPconst paintObserver = newPerformanceObserver((list) => {
for (const entry of list.getEntries()) {
console.log(`${entry.name}: ${entry.startTime.toFixed(0)}ms`)
// → largest-contentful-paint: 1240ms// → first-contentful-paint: 780ms
}
})
paintObserver.observe({ type: 'largest-contentful-paint', buffered: true })
paintObserver.observe({ type: 'paint', buffered: true })
// Disconnect when done (e.g., on component unmount)
observer.disconnect()
Pro Tip & Optimization
Use buffered: true in observe() to capture entries that occurred before the observer was registered — critical for LCP which fires during initial page load before your JavaScript may have finished initializing.
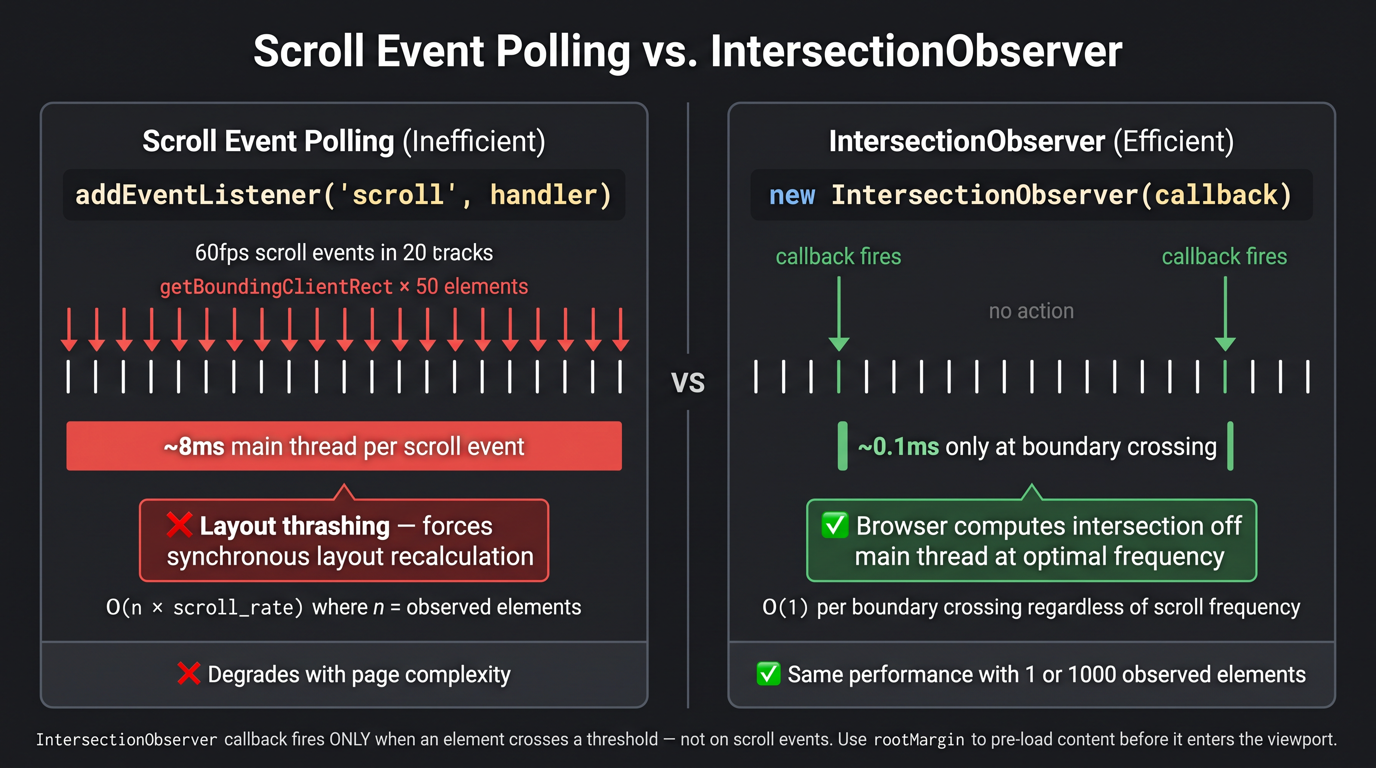
The scroll event fires hundreds of times per second during active scrolling — on the main thread, blocking rendering. The naive pattern for lazy loading checks element positions on every scroll event, which is O(n) per scroll event where n is the number of observed elements.
IntersectionObserver is fundamentally different: it fires callbacks only when elements cross a threshold boundary relative to the viewport. The browser computes intersection at its own optimal frequency (typically once per rendered frame, off the main thread) — not on every scroll event.
TYPESCRIPT
// ❌ Scroll event polling — O(n) per scroll tick, main-thread blockingconst images = document.querySelectorAll('img[data-src]')
window.addEventListener('scroll', () => {
// This fires at 60fps during scrolling
images.forEach((img) => {
const rect = img.getBoundingClientRect()
if (rect.top < window.innerHeight && rect.bottom >= 0) {
// In viewport — load image
img.setAttribute('src', img.getAttribute('data-src')!)
}
})
})
// 60fps × 100 images × getBoundingClientRect() call = Layout Thrashing// ✅ IntersectionObserver — O(1) per boundary crossing, off main threadconst imageObserver = newIntersectionObserver(
(entries, observer) => {
entries.forEach((entry) => {
if (entry.isIntersecting) {
const img = entry.targetasHTMLImageElement
img.src = img.dataset.src!
img.removeAttribute('data-src')
observer.unobserve(img) // Stop observing once loaded
}
})
},
{
rootMargin: '200px', // Load 200px before the image enters the viewportthreshold: 0.1, // Fire when 10% of the element is visibleroot: null, // null = use the browser viewport as root
}
)
document.querySelectorAll('img[data-src]').forEach(img => imageObserver.observe(img))
// IntersectionObserver fires ONLY when an image crosses the 10% visibility threshold// Zero scroll event listeners, zero per-scroll layout calculations
MutationObserver fires callbacks when the DOM structure or attributes change, without requiring polling:
TYPESCRIPT
// ❌ Polling for DOM changes — fires every 100ms regardless of whether anything changedlet previousHTML = document.getElementById('dynamic-content')?.innerHTMLsetInterval(() => {
const currentHTML = document.getElementById('dynamic-content')?.innerHTMLif (currentHTML !== previousHTML) {
console.log('Content changed')
previousHTML = currentHTML
}
}, 100)
// Timer fires 600 times per minute; most firings do nothing// ✅ MutationObserver — fires ONLY when DOM actually changesconst target = document.getElementById('dynamic-content')!
const mutationObserver = newMutationObserver((mutations) => {
mutations.forEach((mutation) => {
if (mutation.type === 'childList') {
console.log('Child nodes added:', mutation.addedNodes.length)
console.log('Child nodes removed:', mutation.removedNodes.length)
}
if (mutation.type === 'attributes') {
console.log(`Attribute changed: ${mutation.attributeName}`)
console.log('New value:', (mutation.targetasElement).getAttribute(mutation.attributeName!))
}
if (mutation.type === 'characterData') {
console.log('Text content changed')
}
})
})
mutationObserver.observe(target, {
childList: true, // Watch for added/removed childrensubtree: true, // Watch entire subtree, not just direct childrenattributes: true, // Watch for attribute changesattributeFilter: ['class', 'aria-expanded'], // Only these attributescharacterData: true, // Watch for text node changes
})
// Stop observing when done// mutationObserver.disconnect()
Expand
Before/After split diagram on scroll event vs Intersection Observer. Left panel labeled 'Scroll Event Polling (Inefficient)' with red border. A timeline show…