Observability: Tracing, Metrics & Debugging the Graph
A GraphQL operation name is not a label — it is the trace correlation key that links a user-visible error to the exact resolver, subgraph, and database query that caused it. Without named operations, distributed GraphQL is undebuggable in production.
GraphQL Backend & API Design
Observability: Tracing, Metrics & Debugging the Graph
You own the schema and the resolvers — the schema is a public contract you can never silently break, and every resolver is a performance commitment you make on every query. Every resolver performance commitment is worthless if you cannot measure it. The default GraphQL observability failure mode is an APM dashboard where every request aggregates under /graphql with no breakdown by operation, no resolver-level latency, and no way to distinguish a 200ms query from a 5,000ms query caused by an undetected N+1. The fix starts before instrumentation: operation naming is the observability contract, and every anonymous operation is a measurement you have permanently lost.
This is Part 5 of the GraphQL Backend & API Design series. It connects directly to Part 3 (Federation) for Apollo Router native OTel spans, and to Part 7 (Schema Evolution) for field usage analytics that make safe deprecation removal possible.
1. Operation Naming as an Operational Contract
The single highest-leverage observability decision in a GraphQL backend is enforcing named operations. Every anonymous operation (query { users { id } } with no name) produces an APM entry with the metric key /graphql — indistinguishable from every other operation.
Enforce named operations at the server layer, not just as a convention. graphql-armor v3 provides blockFieldSuggestion and enforceNamedOperations rules. Apollo Router can reject anonymous operations via a policy. Anonymous operations that reach production generate APM noise that is permanently unclassifiable — there is no retroactive fix.
2. OpenTelemetry Spans: From Client to DB
A complete GraphQL OTel trace should show the full execution tree — from the root Query.users resolver down through User.orders DataLoader spans to the underlying database query.
2.1 Apollo Router Native OTel (Zero Config)
Apollo Router emits OTel spans natively from v1.30+ without a plugin:
Each Router-generated span includes:
graphql.operation.name— the PascalCase operation namegraphql.operation.type—query | mutation | subscriptiongraphql.document— the full operation document (can be omitted for security)http.status_code— the HTTP response code
2.2 Resolver-Level Spans (Node.js Subgraphs)
2.3 The x-request-id Propagation Chain
All subgraph spans should propagate the same x-request-id header into their OTel trace context. This allows Jaeger/Zipkin to correlate the Router root span with all downstream spans into one complete distributed trace.
3. GraphQL-Specific APM Metrics
Standard HTTP-level APM metrics (request rate, p95 latency, error rate by status code) are insufficient for GraphQL:
- All operations share one HTTP endpoint → status code is always 200 (even on errors)
- All operations have different cost profiles → p95 by endpoint is meaningless
The GraphQL-specific metrics that matter:
| Metric | Key | Why It Matters |
|---|---|---|
| Operation p95 latency | graphql.operation.name |
Separate slow operations from fast ones |
| Resolver p95 latency | graphql.field |
Find which field is the bottleneck |
| DataLoader batch size | dataloader.batch_size |
batchSize: 1 = N+1 still present |
| Error rate by code | extensions.code |
UNAUTHENTICATED spike = auth service degraded |
| Operation usage count | graphql.operation.name |
Safe to deprecate when count drops to 0 |
| Field usage count | graphql.field |
Safe to remove when count drops to 0 |
Set an alert: if dataloader.batch_size p50 drops below 5 for a given loader, the DataLoader's batching window is not collecting keys before firing. Root cause: an await loader.load(key) call that resolves before the next resolver call registers its key. Fix: collect all loader.load() calls first, then await Promise.all(promises).
4. Field Usage Analytics for Safe Deprecation
The most operationally valuable observability data is field usage: which @deprecated fields are still being called, by which operations, and when they were last used.
4.1 graphql-inspector Field Usage
4.2 Apollo GraphOS Field Insights
If you use Apollo Studio (Apollo GraphOS), field usage is tracked automatically from Router spans:
5. Observability in Federation: Distributed Trace Assembly
In a federated architecture, a single client operation generates traces across multiple services. The complete trace must be assembled from:
- Router root span — operation name, query plan duration, total time
- Users subgraph span — time to resolve
User.name, DB query duration - Orders subgraph span — time to resolve
User.orders, entity lookup, DB query duration - DataLoader spans — batch size, batch window duration
Apollo Router v1.40+ emits OTel spans for every subgraph fetch automatically. In the Jaeger UI, filter by graphql.operation.name = "GetUserWithOrders" to see the complete distributed trace across all subgraphs without any manual correlation.
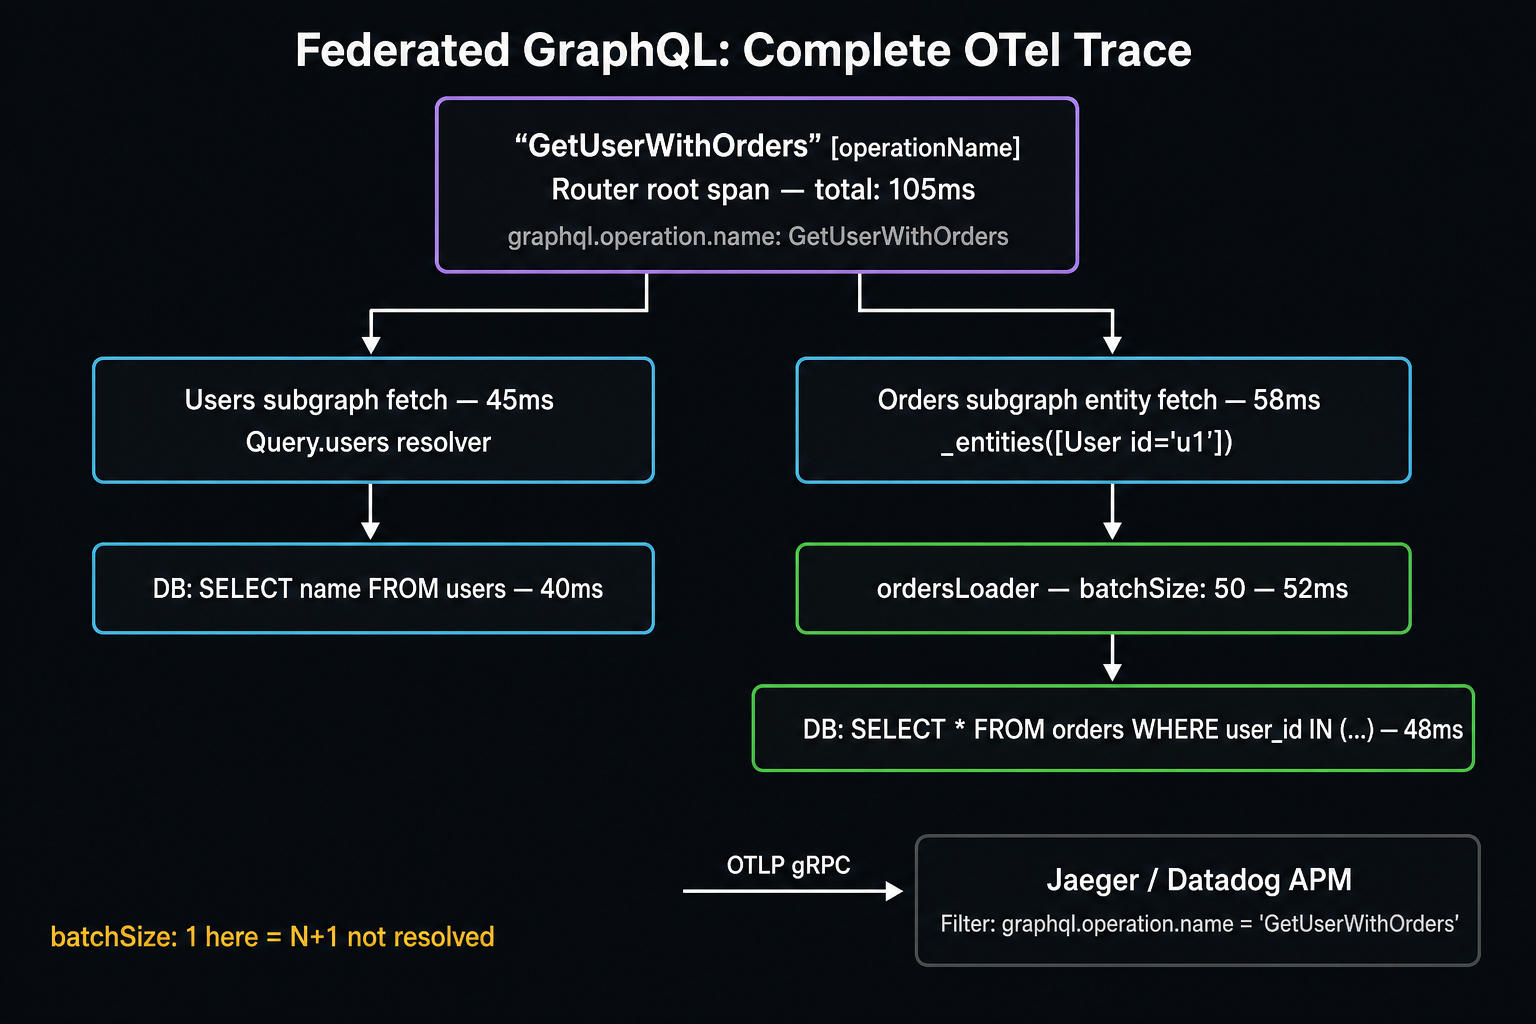
The operation name "GetUserWithOrders" becomes the root span label. Apollo Router emits sub-spans per subgraph fetch. Each subgraph emits resolver and DataLoader spans. The full distributed trace is assembled in Jaeger via the x-request-id propagation chain.
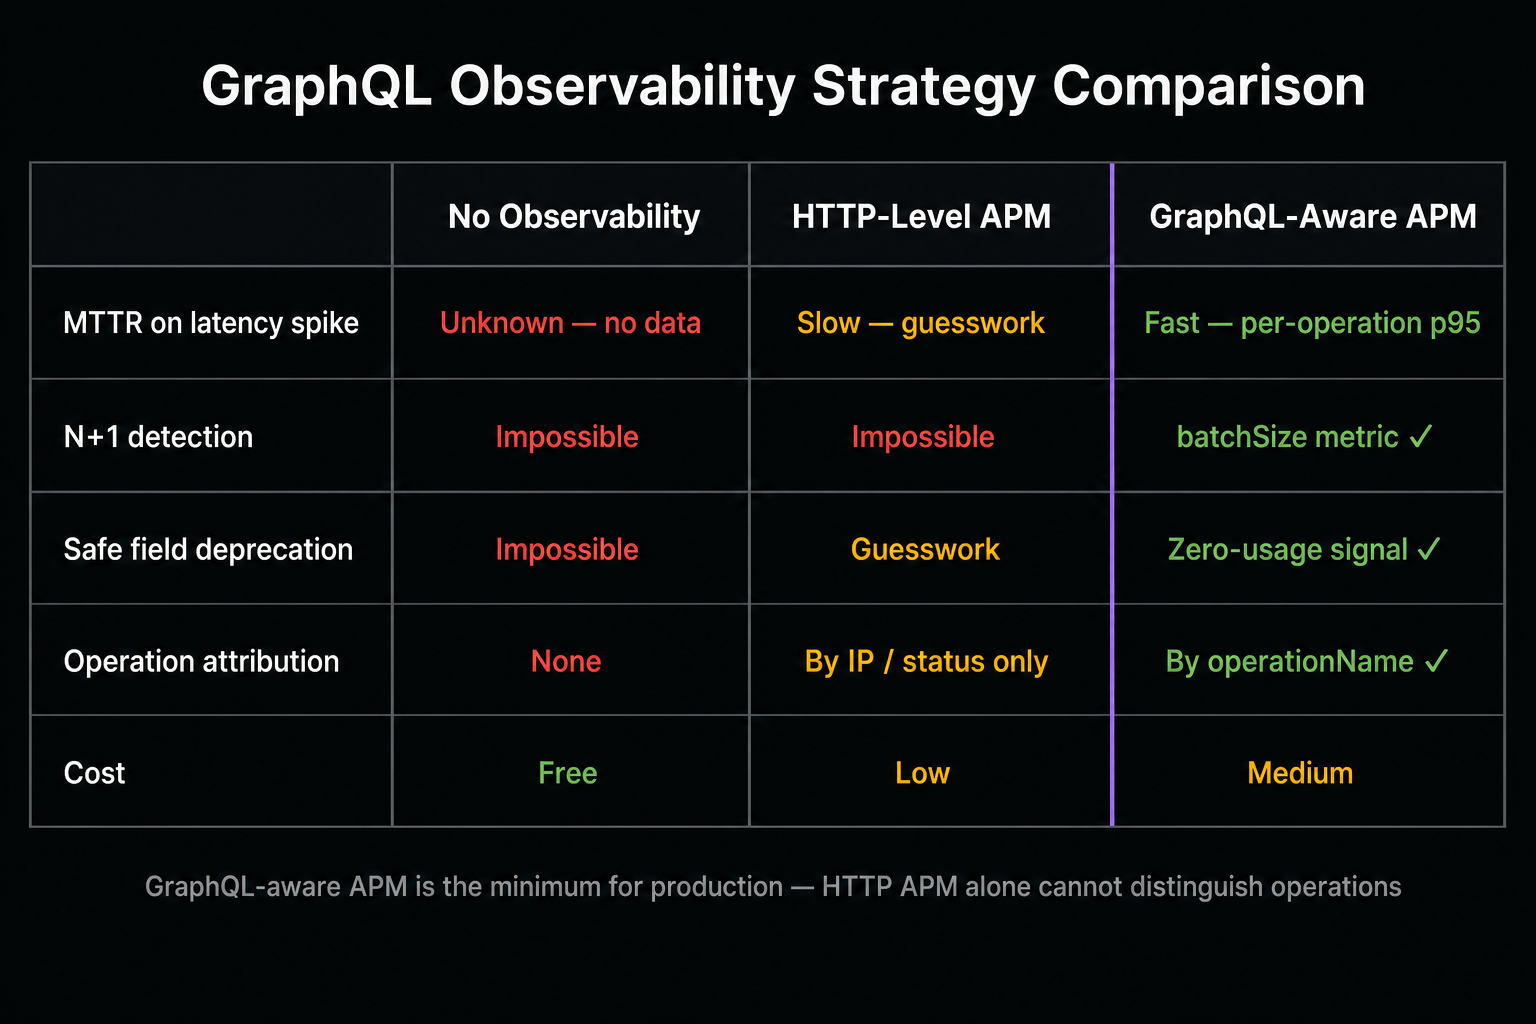
HTTP-level APM cannot distinguish GraphQL operations — all requests aggregate under /graphql. GraphQL-aware APM (Apollo Studio, OTel + Jaeger) provides per-operation and per-field metrics, making N+1 detection and safe field deprecation measurable.
Summary
| Concept | Rule |
|---|---|
| Operation naming | Named operations are the observability contract. Every anonymous operation is a measurement permanently lost — enforce naming at the server layer via graphql-armor or Router policy. |
| Apollo Router OTel | Router v1.40+ emits OTel spans per-subgraph-fetch natively. No plugin, no code change in subgraphs — just configure the otlp.endpoint in router.yaml. |
| DataLoader batch size | dataloader.batch_size: 1 in an APM trace is the N+1 signature. Instrument batch size as a histogram metric and alert on low p50 values. |
x-request-id propagation |
The Router sets a x-request-id header on every subgraph request. All subgraph OTel spans must propagate this header to enable complete distributed trace assembly in Jaeger/Zipkin. |
| Field usage analytics | graphql-inspector field-usage or Apollo GraphOS field insights provide "last used" date and request count for every @deprecated field — the only safe signal for when a field can be removed. |
What's Next
Part 6 — Schema Security covers the attack surface that an exposed GraphQL schema presents: recursive queries, alias amplification, introspection recon, and the three-gate defense model (depth limit → complexity budget → persisted operations manifest) that makes your schema safe for public exposure.
This article was developed with AI-assisted deep search, specification cross-referencing, and technical research synthesis.